File:Phase-diag.svg
跳转到导航
跳转到搜索

此SVG文件的PNG预览的大小:575 × 443像素。 其他分辨率:312 × 240像素 | 623 × 480像素 | 997 × 768像素 | 1,280 × 986像素 | 2,560 × 1,972像素。
原始文件 (SVG文件,尺寸为575 × 443像素,文件大小:16 KB)
| 描述 |
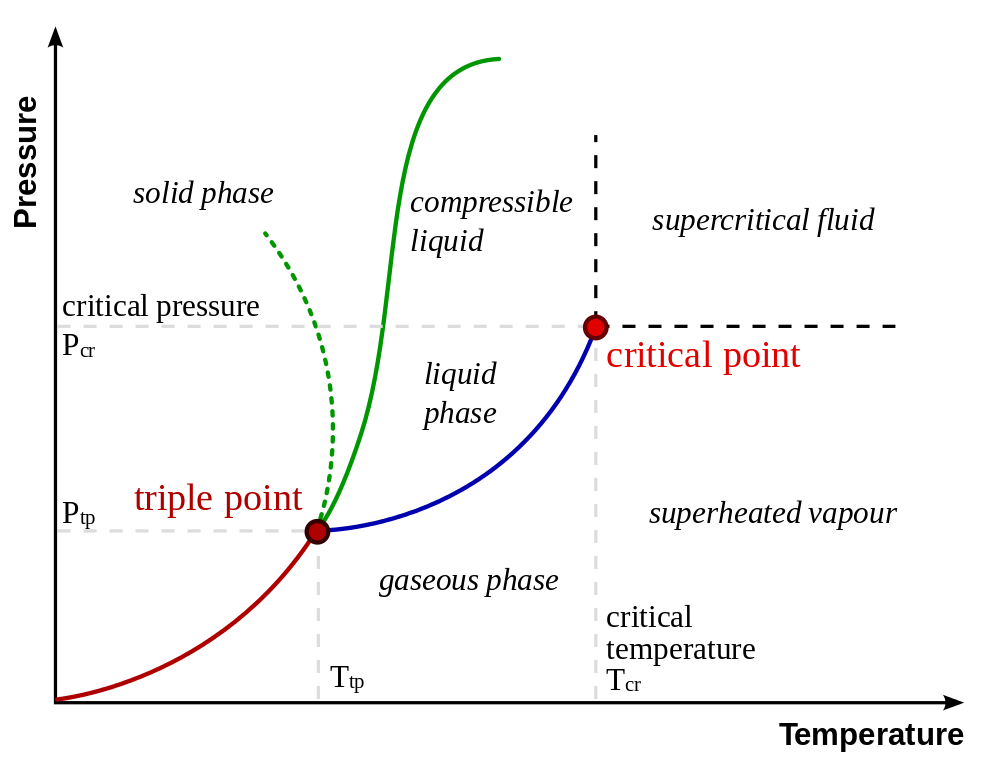
Deutsch: Ein typisches Phasendiagramm für ein einzelnes Material, die feste, flüssige und gasförmige Phase herausstellend. Die durchgezogene grüne Linie zeigt die übliche Form einer flüssig-fest-Phasen-Linie. Die gepunktete grüne Linie zeigt das anomale Verhalten von Wasser.
English: A typical phase diagram for a single-component material, exhibiting solid, liquid and gaseous phases. The solid green line shows the usual shape of the liquid-solid phase line. The dotted green line shows the anomalous behavior of water. |
||||||||
| 日期 | |||||||||
| 来源 | SVG conversion from raster image Image:Phase-diag.png; some additions from Image:Phase diagram.png | ||||||||
| 作者 | Maksim; vector version by Booyabazooka | ||||||||
| 授权 (二次使用本文件) |
Maksim,本作品著作权人,特此采用以下许可协议发表本作品:
|
||||||||
| 其他版本 |
此文件衍生的作品: []
With a more realistic melting curve for ice:
|


文件历史
点击某个日期/时间查看对应时刻的文件。
| 日期/时间 | 缩略图 | 大小 | 用户 | 备注 | |
|---|---|---|---|---|---|
| 当前 | 2007年2月25日 (日) 16:11 | | 575 × 443(16 KB) | wikimediacommons>EnEdC | Add over-critical labels from Image:Phase diagram.png |
文件用途
没有页面使用本文件。